TRUST CONTEXT ENGINE
Why context quality determines
trust measurement.
Most tools read the same public sources. The difference is what they do with them. We maintain a live causal model of your entire stakeholder landscape — grievances, commitments, networks, and precedent.
001
Every tool measures social trust by asking individuals. None of them see the network.
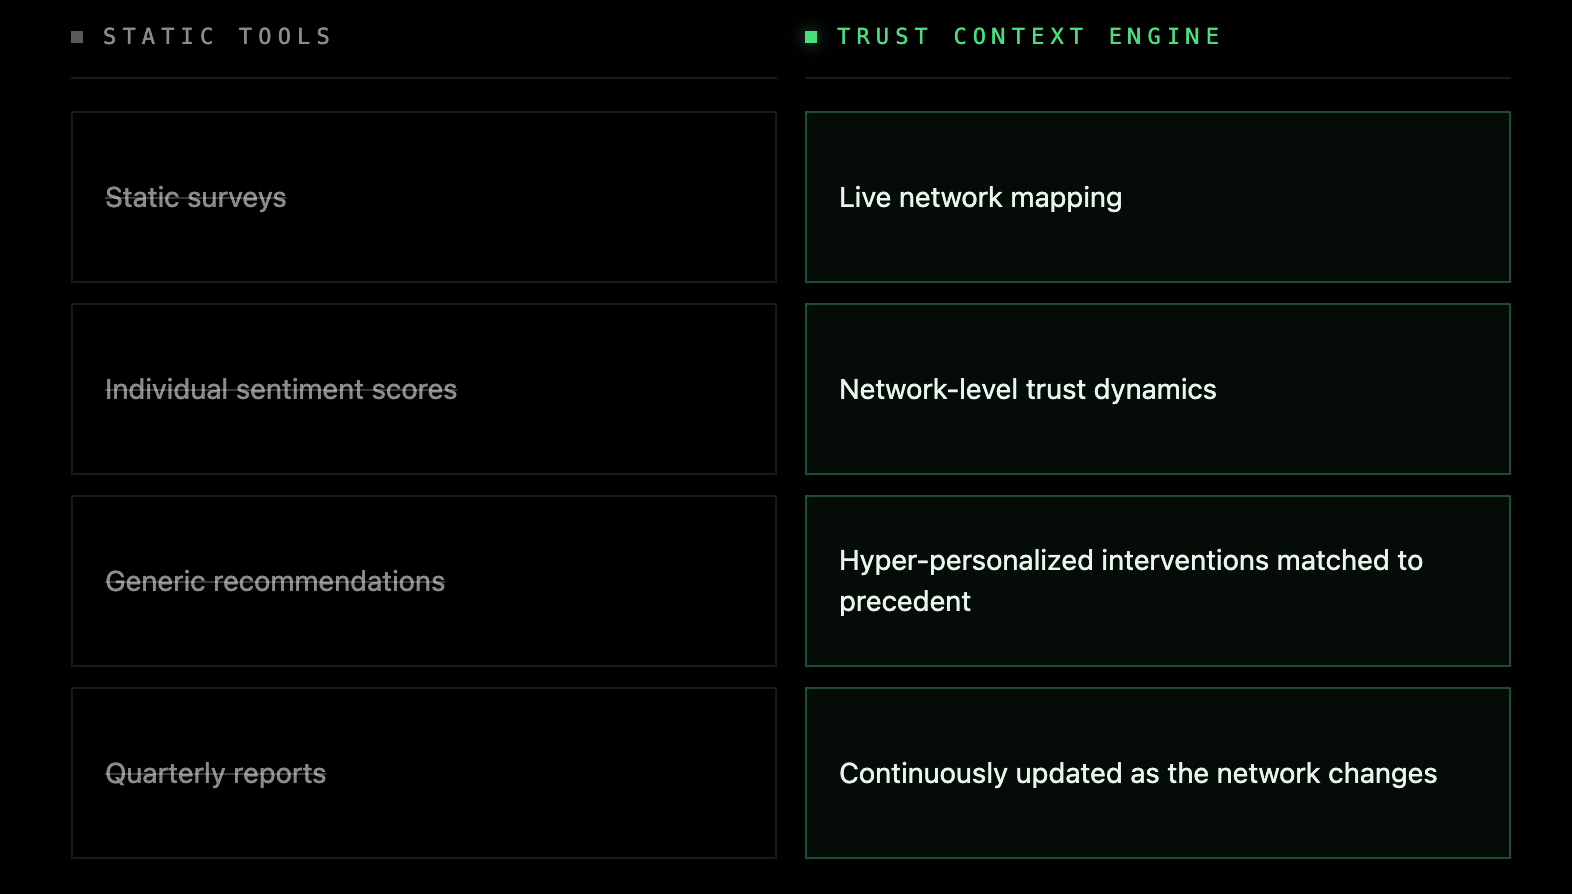
Surveys capture sentiment at a single point in time. CRMs log meetings and count interactions. Assessments deliver a snapshot — accurate the day it’s written. All of them treat social trust as a quantity you can poll — ask enough people, aggregate the scores, report the number. But social trust is a property that emerges from the network. It exists in the relationships between stakeholders, not inside any individual. It forms when commitments address root cause externalities and propagates through bridges to adjacent stakeholders. It breaks when commitments go unverified and the network reconnects through a different grievance. Static tools can’t see this because they don’t map the network. They measure individuals and hope the sum represents the whole. It doesn’t.
WHAT STATIC TOOLS MISS
—The hidden stakeholder network connecting actors through shared grievances
— Which chokeholds are structural and which are symptoms
— Whether commitments address root cause externalities or just the periphery
— How close the network is to forming a blocking coalition
— What happened at comparable sites — and what worked
002
The hidden architecture.
Every social conflict has a hidden network architecture. Grievances connect stakeholders into coalitions. Some commitments neutralize those grievances. Most don’t. The Trust Context Engine reveals the structure underneath every project — which grievances connect which actors, which commitments hold, and where the network is heading next.
THE PIPELINE
Stakeholder data → Causal Context Graph → Verification Agents → CGR → Scenarios

Ingest
SRM exports, legal filings, field reports, news, and regulatory data. Every source is structured into the same causal model. Client data has one destination: your own deliverable, inside your own tenant. The score is different — it computes from public records only. There is no port for private inputs.

Structure
The engine maps connections: stakeholder to grievance, grievance to root cause externality, commitment to chokehold. Bridge power scored. Coalition paths identified. Verification agents check whether each commitment was funded, completed, and reached the root cause externality.

Act
CGR calculated. Chokeholds ranked by network impact. Precedent matches surfaced from the Library. Your team knows where to intervene — and what happened last time this pattern appeared.
003
Map the network. Measure trust dynamics. Assess fragility. Recommend where to act.
Capability 1
The Causal Context Graph maps the hidden stakeholder network — who connects to whom through which grievances, where clusters are forming, and which stakeholders bridge local concerns to international amplification.
Capability 2
The CGR — the commitment–grievance ratio — is the share of recorded grievances that have a verified answer, weighted on the asset’s network, so an unanswered grievance at a bridge actor counts for more than one at the periphery. The score runs from 0 — nothing answered — to 1 — everything answered. Commitments are counted only through the grievances they resolve. Unverified counts as zero. Answers that miss the root cause decay; answers that reach it hold.
Capability 3
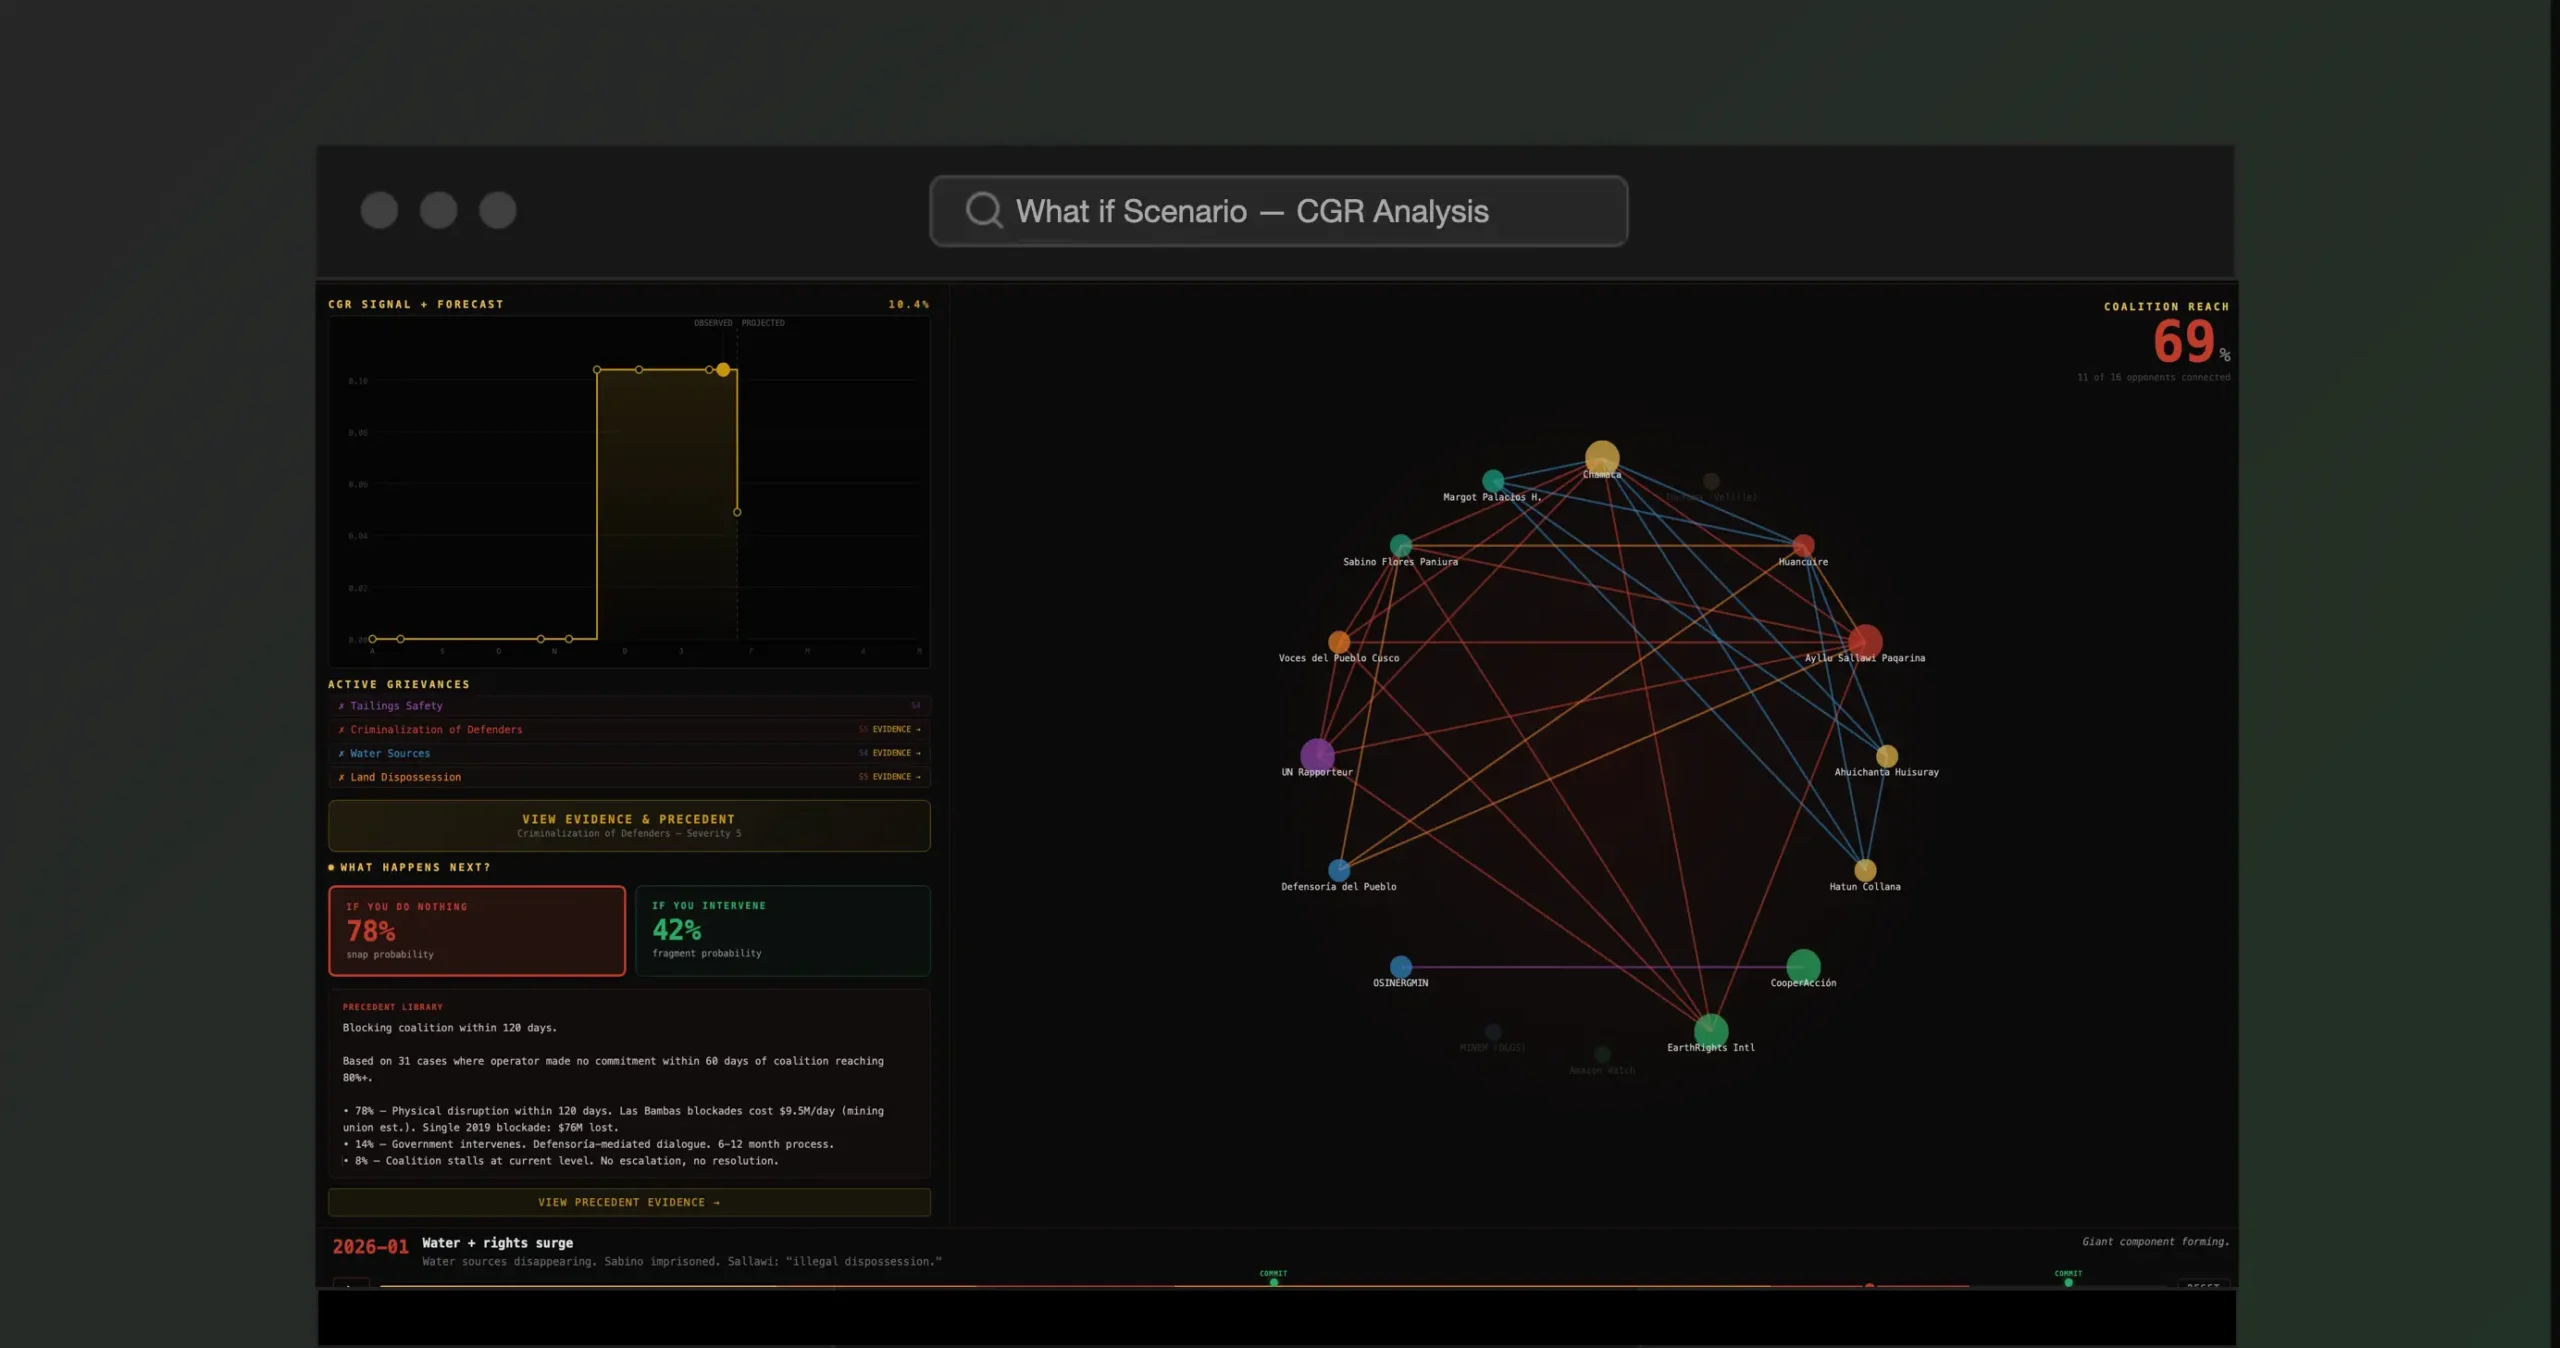
The Precedent Library matches your current network pattern against every comparable case — same grievance type, severity, culture, stakeholder configuration. It tells you how close the network is to a tipping point and what happened at sites similar to yours.
Capability 4
Hyper-personalized intervention. Not a general recommendation — the specific commitment that addresses the binding chokehold for this network, at this site, for this stakeholder configuration. Grounded in what worked at comparable sites.
The Precedent Library matches your current network pattern against every comparable case — same grievance type, severity, culture, stakeholder configuration. It tells you how close the network is to a tipping point and what happened at sites similar to yours.
004
The difference isn't how much you spend. It's whether the spending reaches the right chokehold.
Across resolved cases in the Precedent Library, commitments misaligned with the actual root cause externality decay quickly toward zero on the CGR. Commitments that reach the root cause externality hold. Same operator, same period, same spend.
A water tanker is a symptom. Water rights are the root cause externality. A scholarship fund is a symptom. Access to the environmental review process is the root cause externality. The Trust Context Engine identifies which chokeholds are structural — and which commitments actually reach them.
005
Not a dashboard. Not a survey. A live causal model.
006
What the engine matches against.
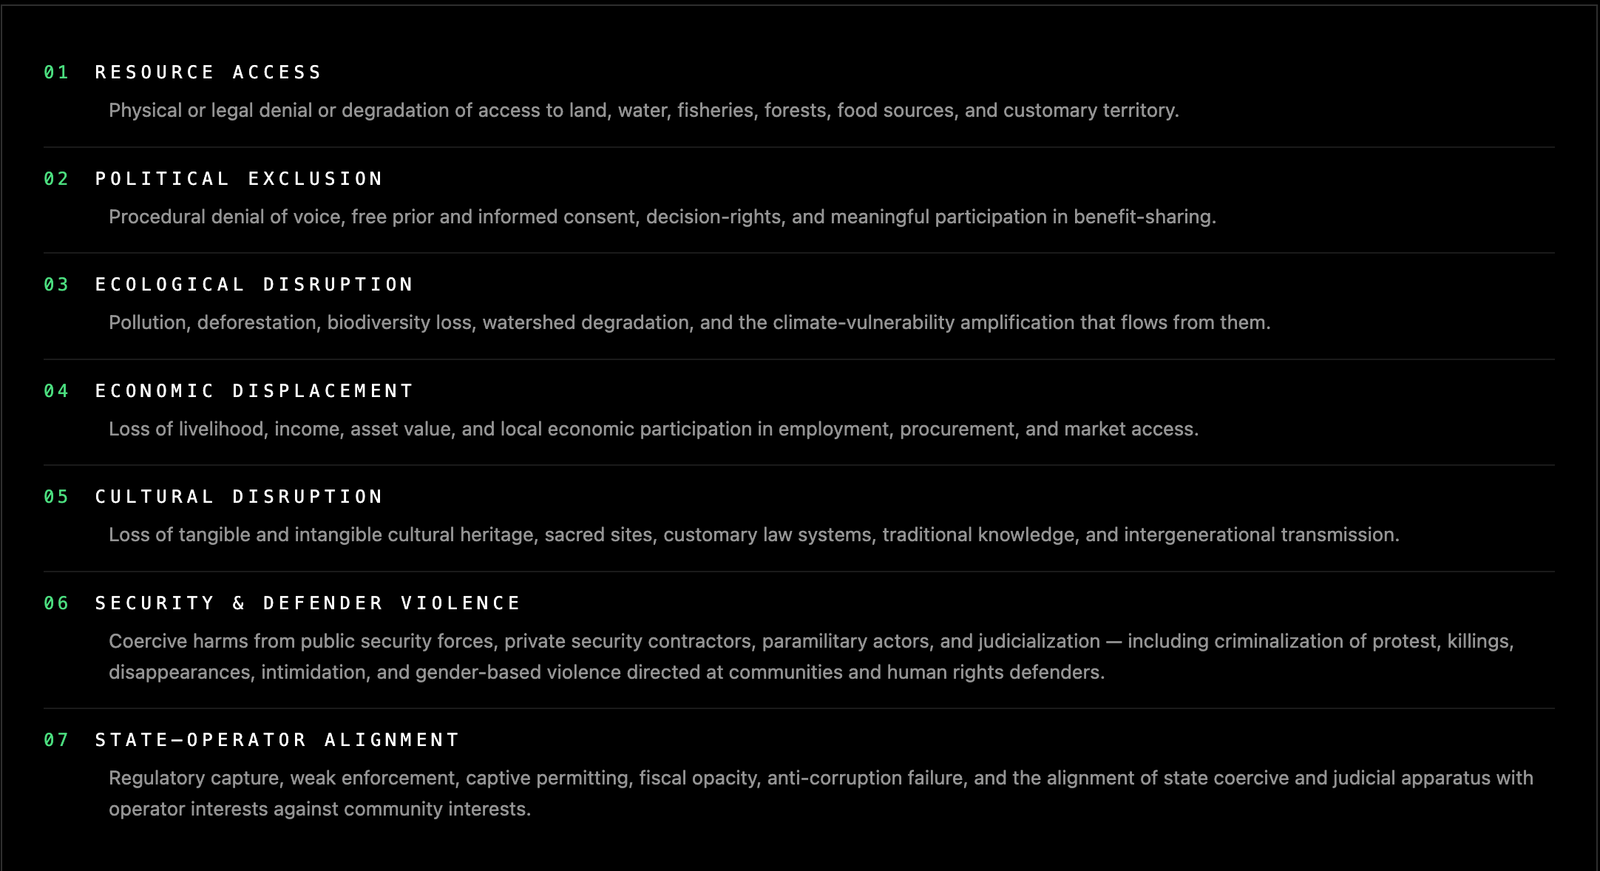
Every social conflict in resource-constrained, consensus-dependent industries traces to one of seven structural externalities. These are not categories TrustDynamics invented. They are derived from the framework crosswalk against IFC Performance Standards 1-8, GRI Topic Standards (411, 413, 408, 409, 410), the OECD Guidelines, ICMM Performance Expectations, the Voluntary Principles on Security and Human Rights, ILO Convention 169, and the empirical field record across three decades of resolved cases.
See the methodology run live on your portfolio.
Request a demo. We’ll walk you through the Causal Context Graph, the CGR, and the Precedent Library — applied to a project from your portfolio.
Making trust measurable — so that answering communities becomes the rational use of capital.

PRODUCT
LEGAL
- Privacy Policy
- Terms of Service